I took a project from 0 to 1 in 4 days. I started with a vague definition of the problem and some raw materials and, collaborating with sales, clients and engineers, came up with a fully formed feature that our clients loved.
ClientQatium, 2025
ToolsResearch, ideation, design (Figma) and front end development (TypeScript, React, SVG, Storybook)
Problem
Create a feature that allows our clients to calculate the energy efficiency of their water networks, and compare them with other networks in the app.
Context
This project started with a surprise meeting on a random Wednesday. I
got a ping from the sales team, asking me to join a call with a
potential client the next day, and was given a couple of recordings of
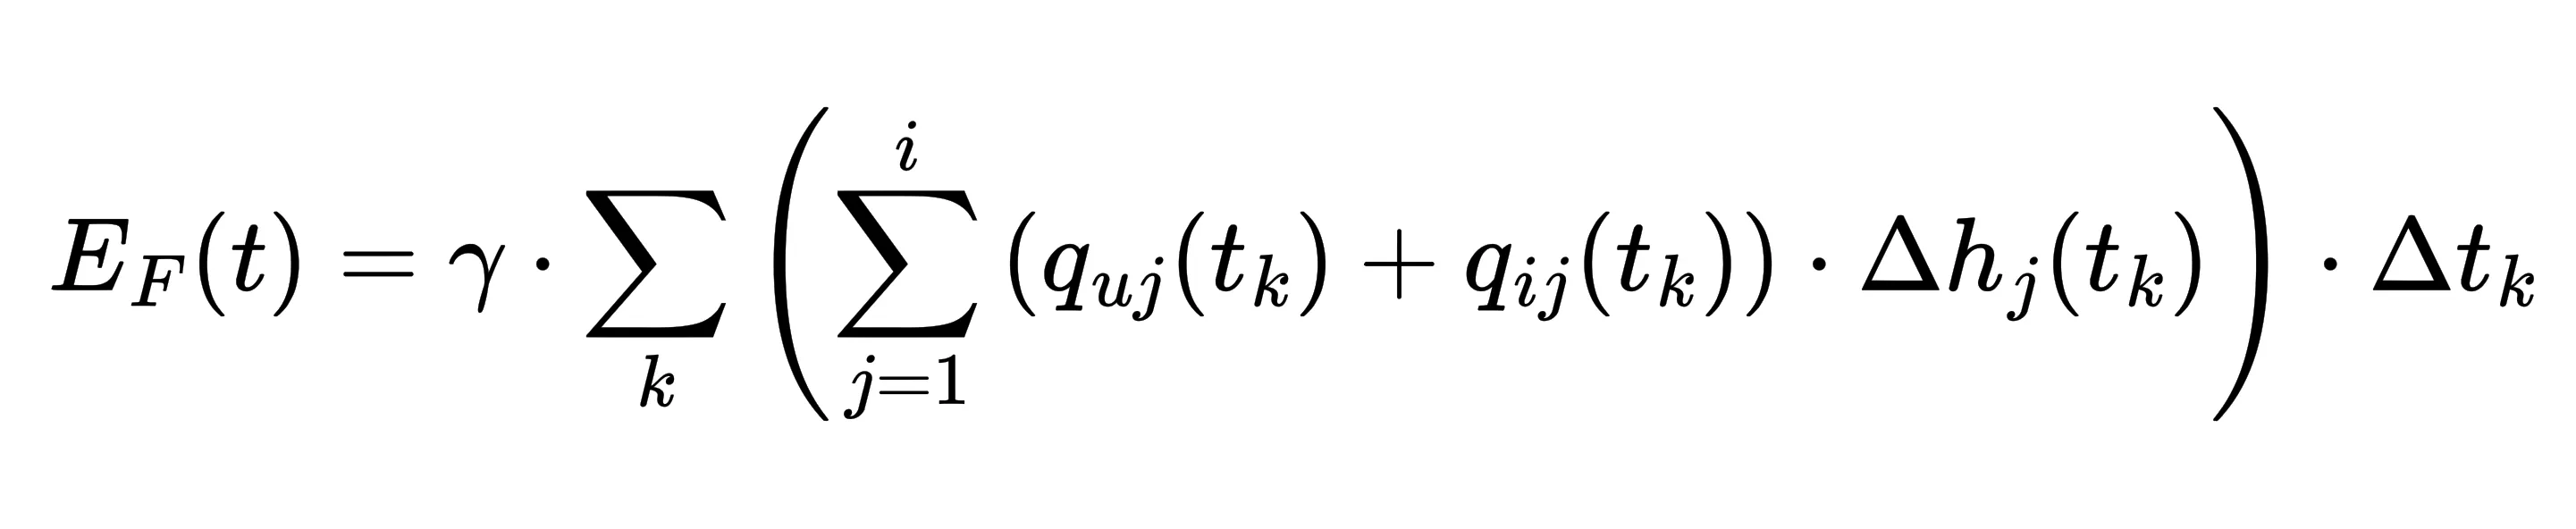
the client’s previous meetings to get up to speed. I also had a PDF with
formulas like this one:
Fun fact: the PDF used low resolution images for the formulas, so I
used
ChatGPT
to translate the image of the formula to LaTeX, which I then pasted into
an online LaTeX editor to
get a high resolution version of it that I could screenshot for this website.
I spent the rest of the day watching recordings, reading transcripts and
the PDF, and having an express meeting with one of our hydraulic
engineers, who explained the formulas to me.
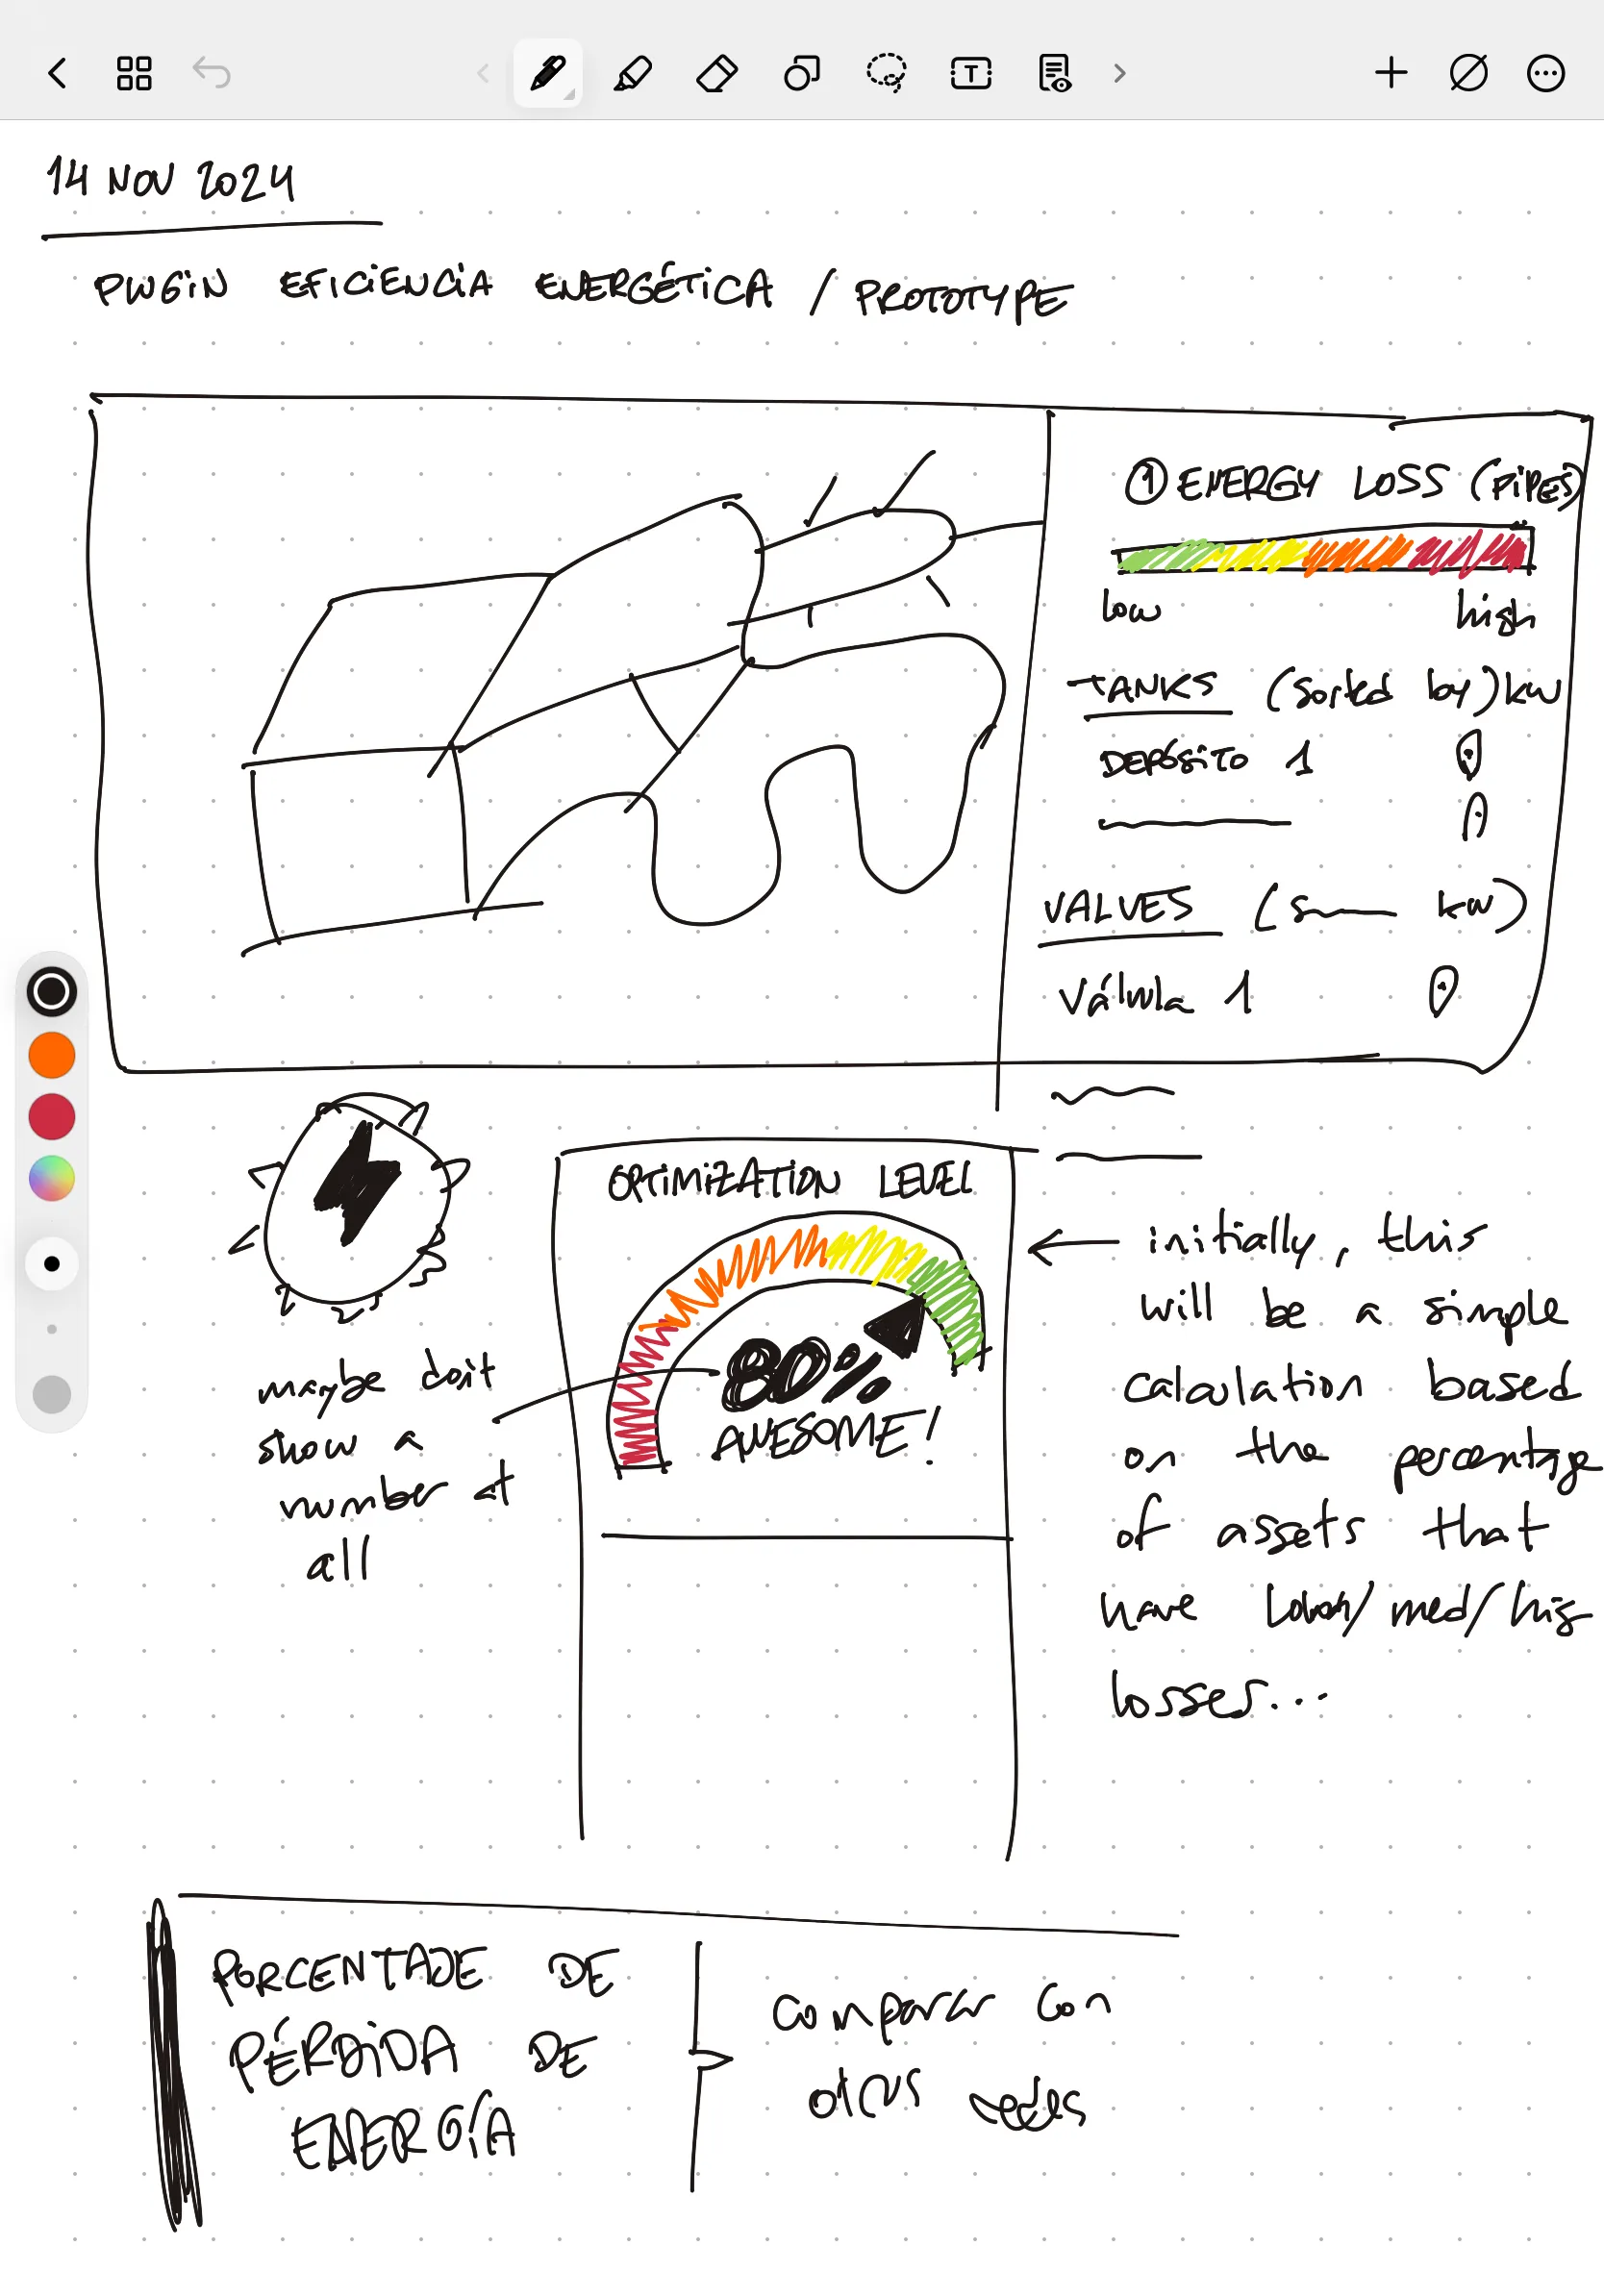
The next day, I joined the call with the client, got some very good
ideas from listening to them, and by the end of the day I had a rough
sketch of the plugin we were going to build:
Solution
Calculating the actual energy efficiency of a network in terms our customers
want to see (money, basically) is not trivial for multiple reasons.
Instead, I came up with an idea to calculate a unit-less energy
efficiency score for their water networks, similar to what you see in
sport watches. This would allow our customers to compare their networks
with each other, and with other networks in the app, to hopefully
motivate them to improve their score.
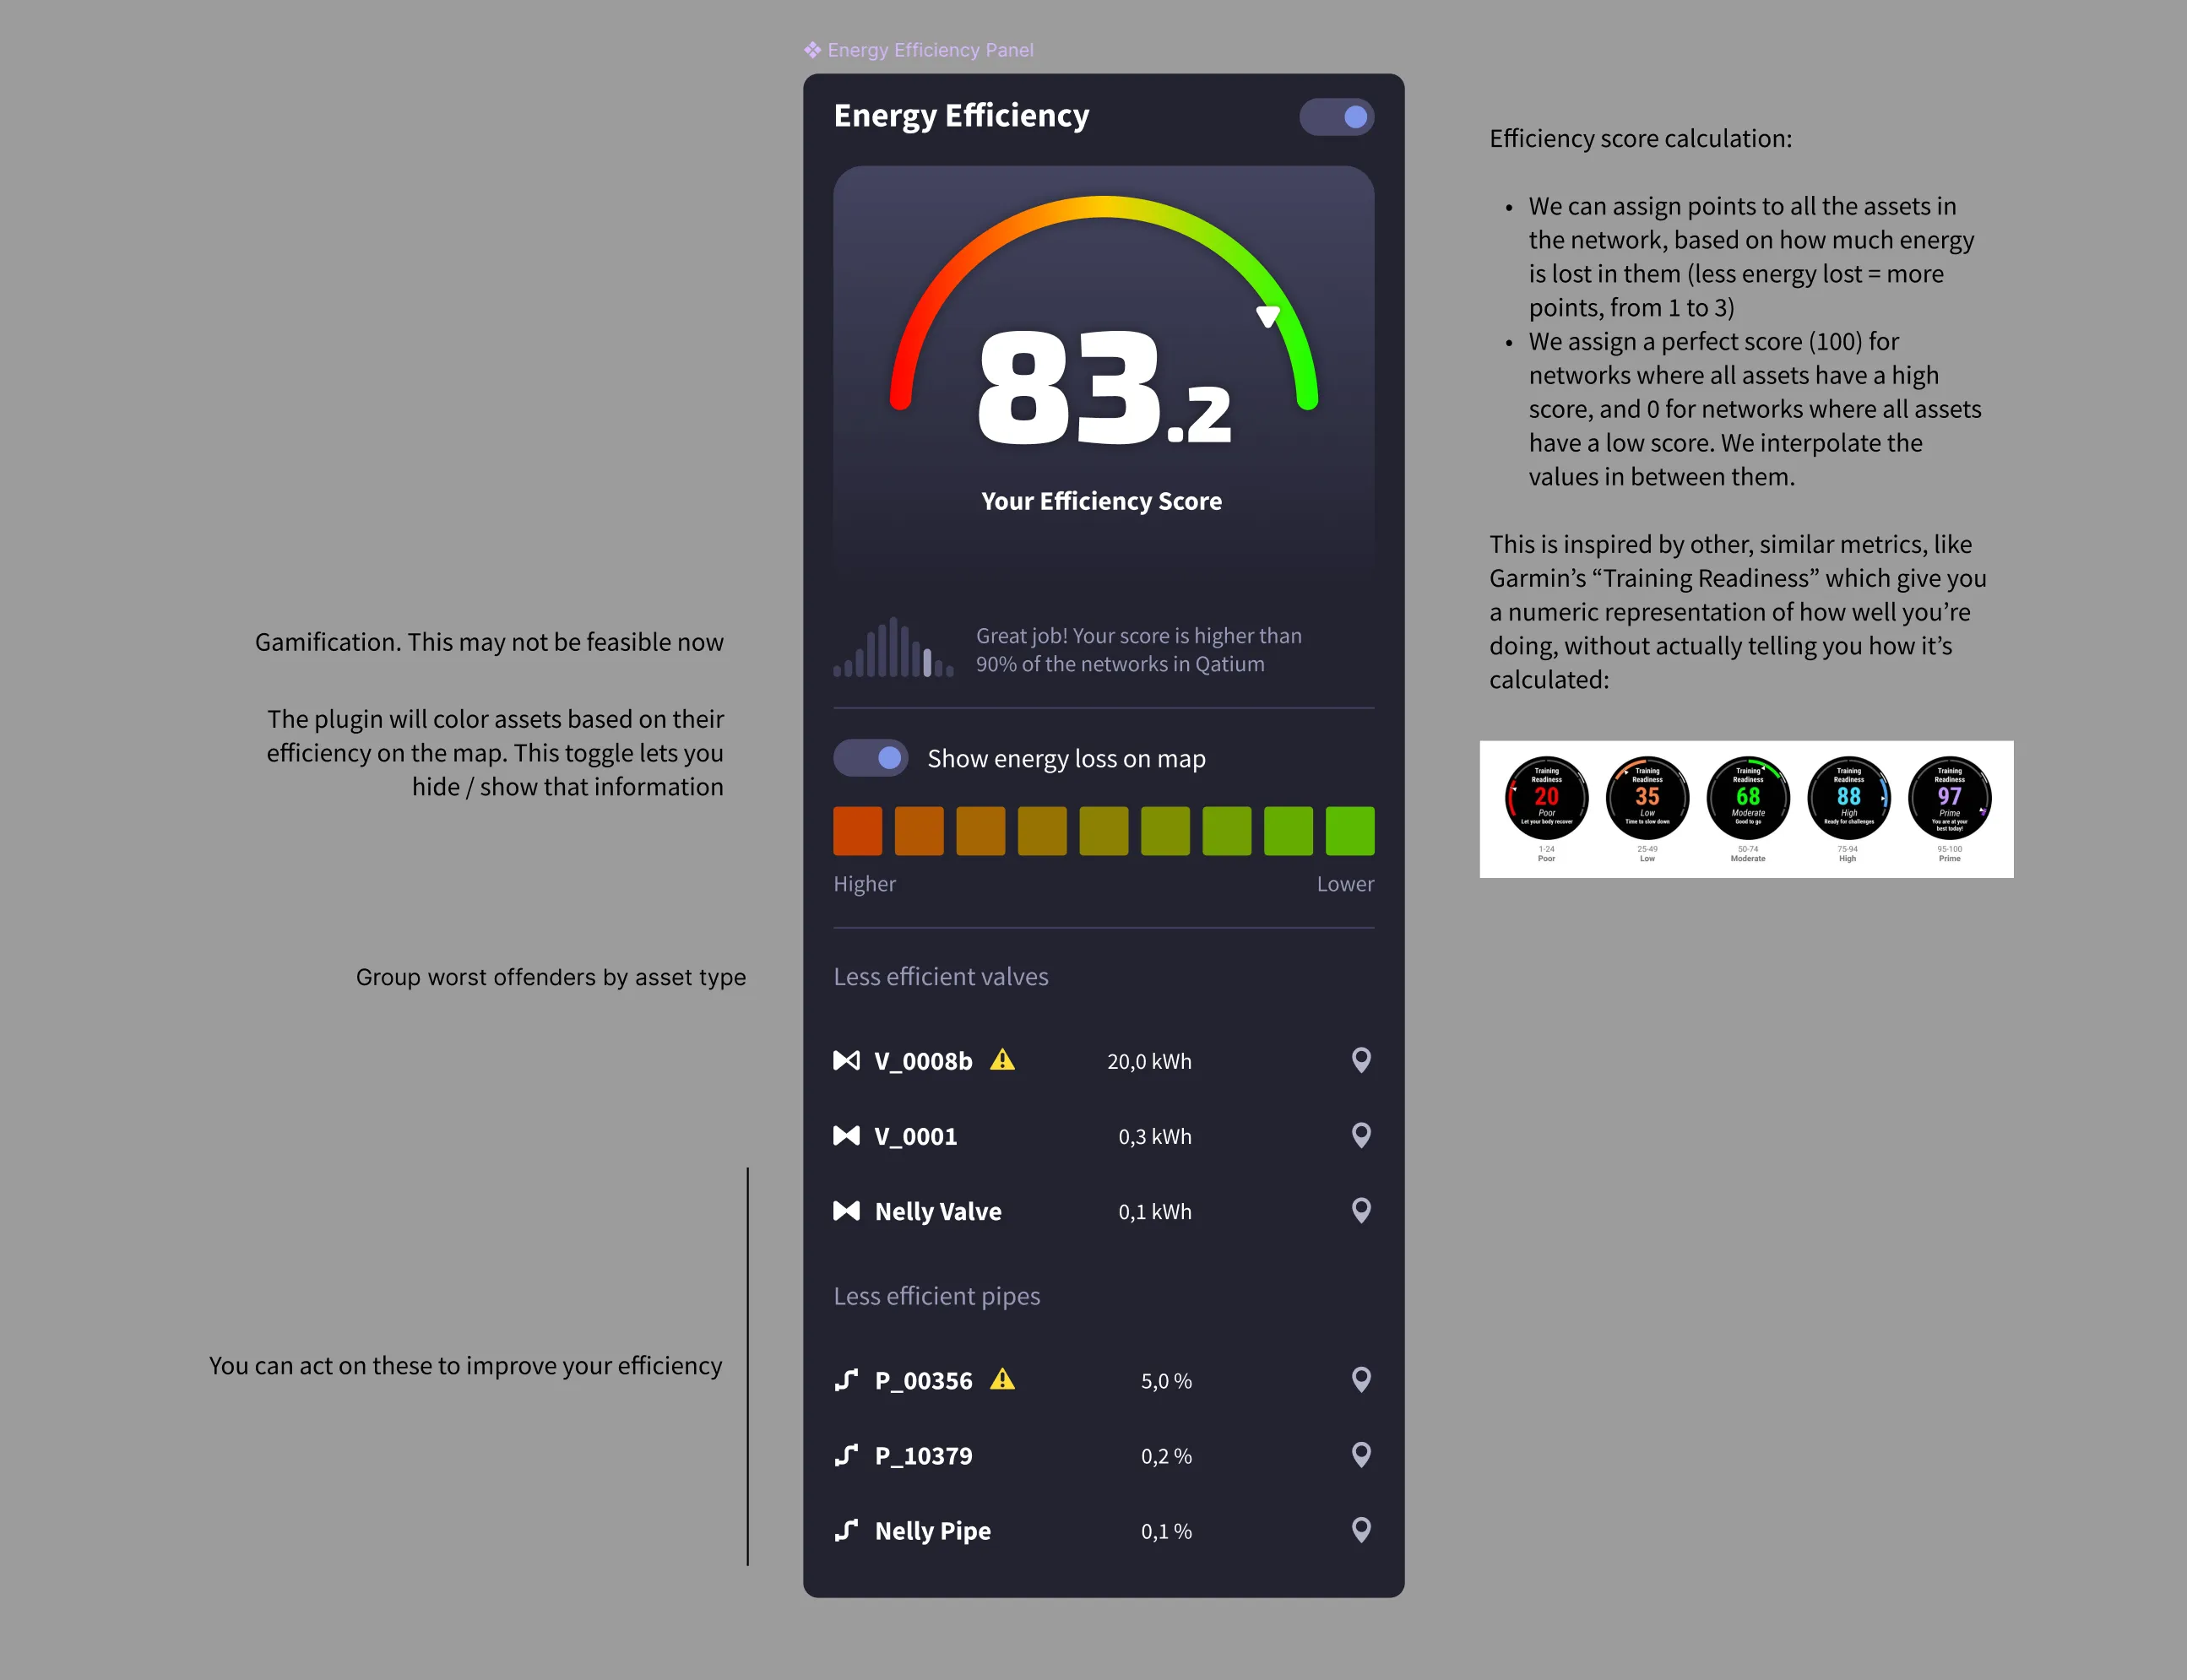
Once I validated the idea with our hydraulic engineer and our sales
team, I started working on a static mockup of the feature on Figma:
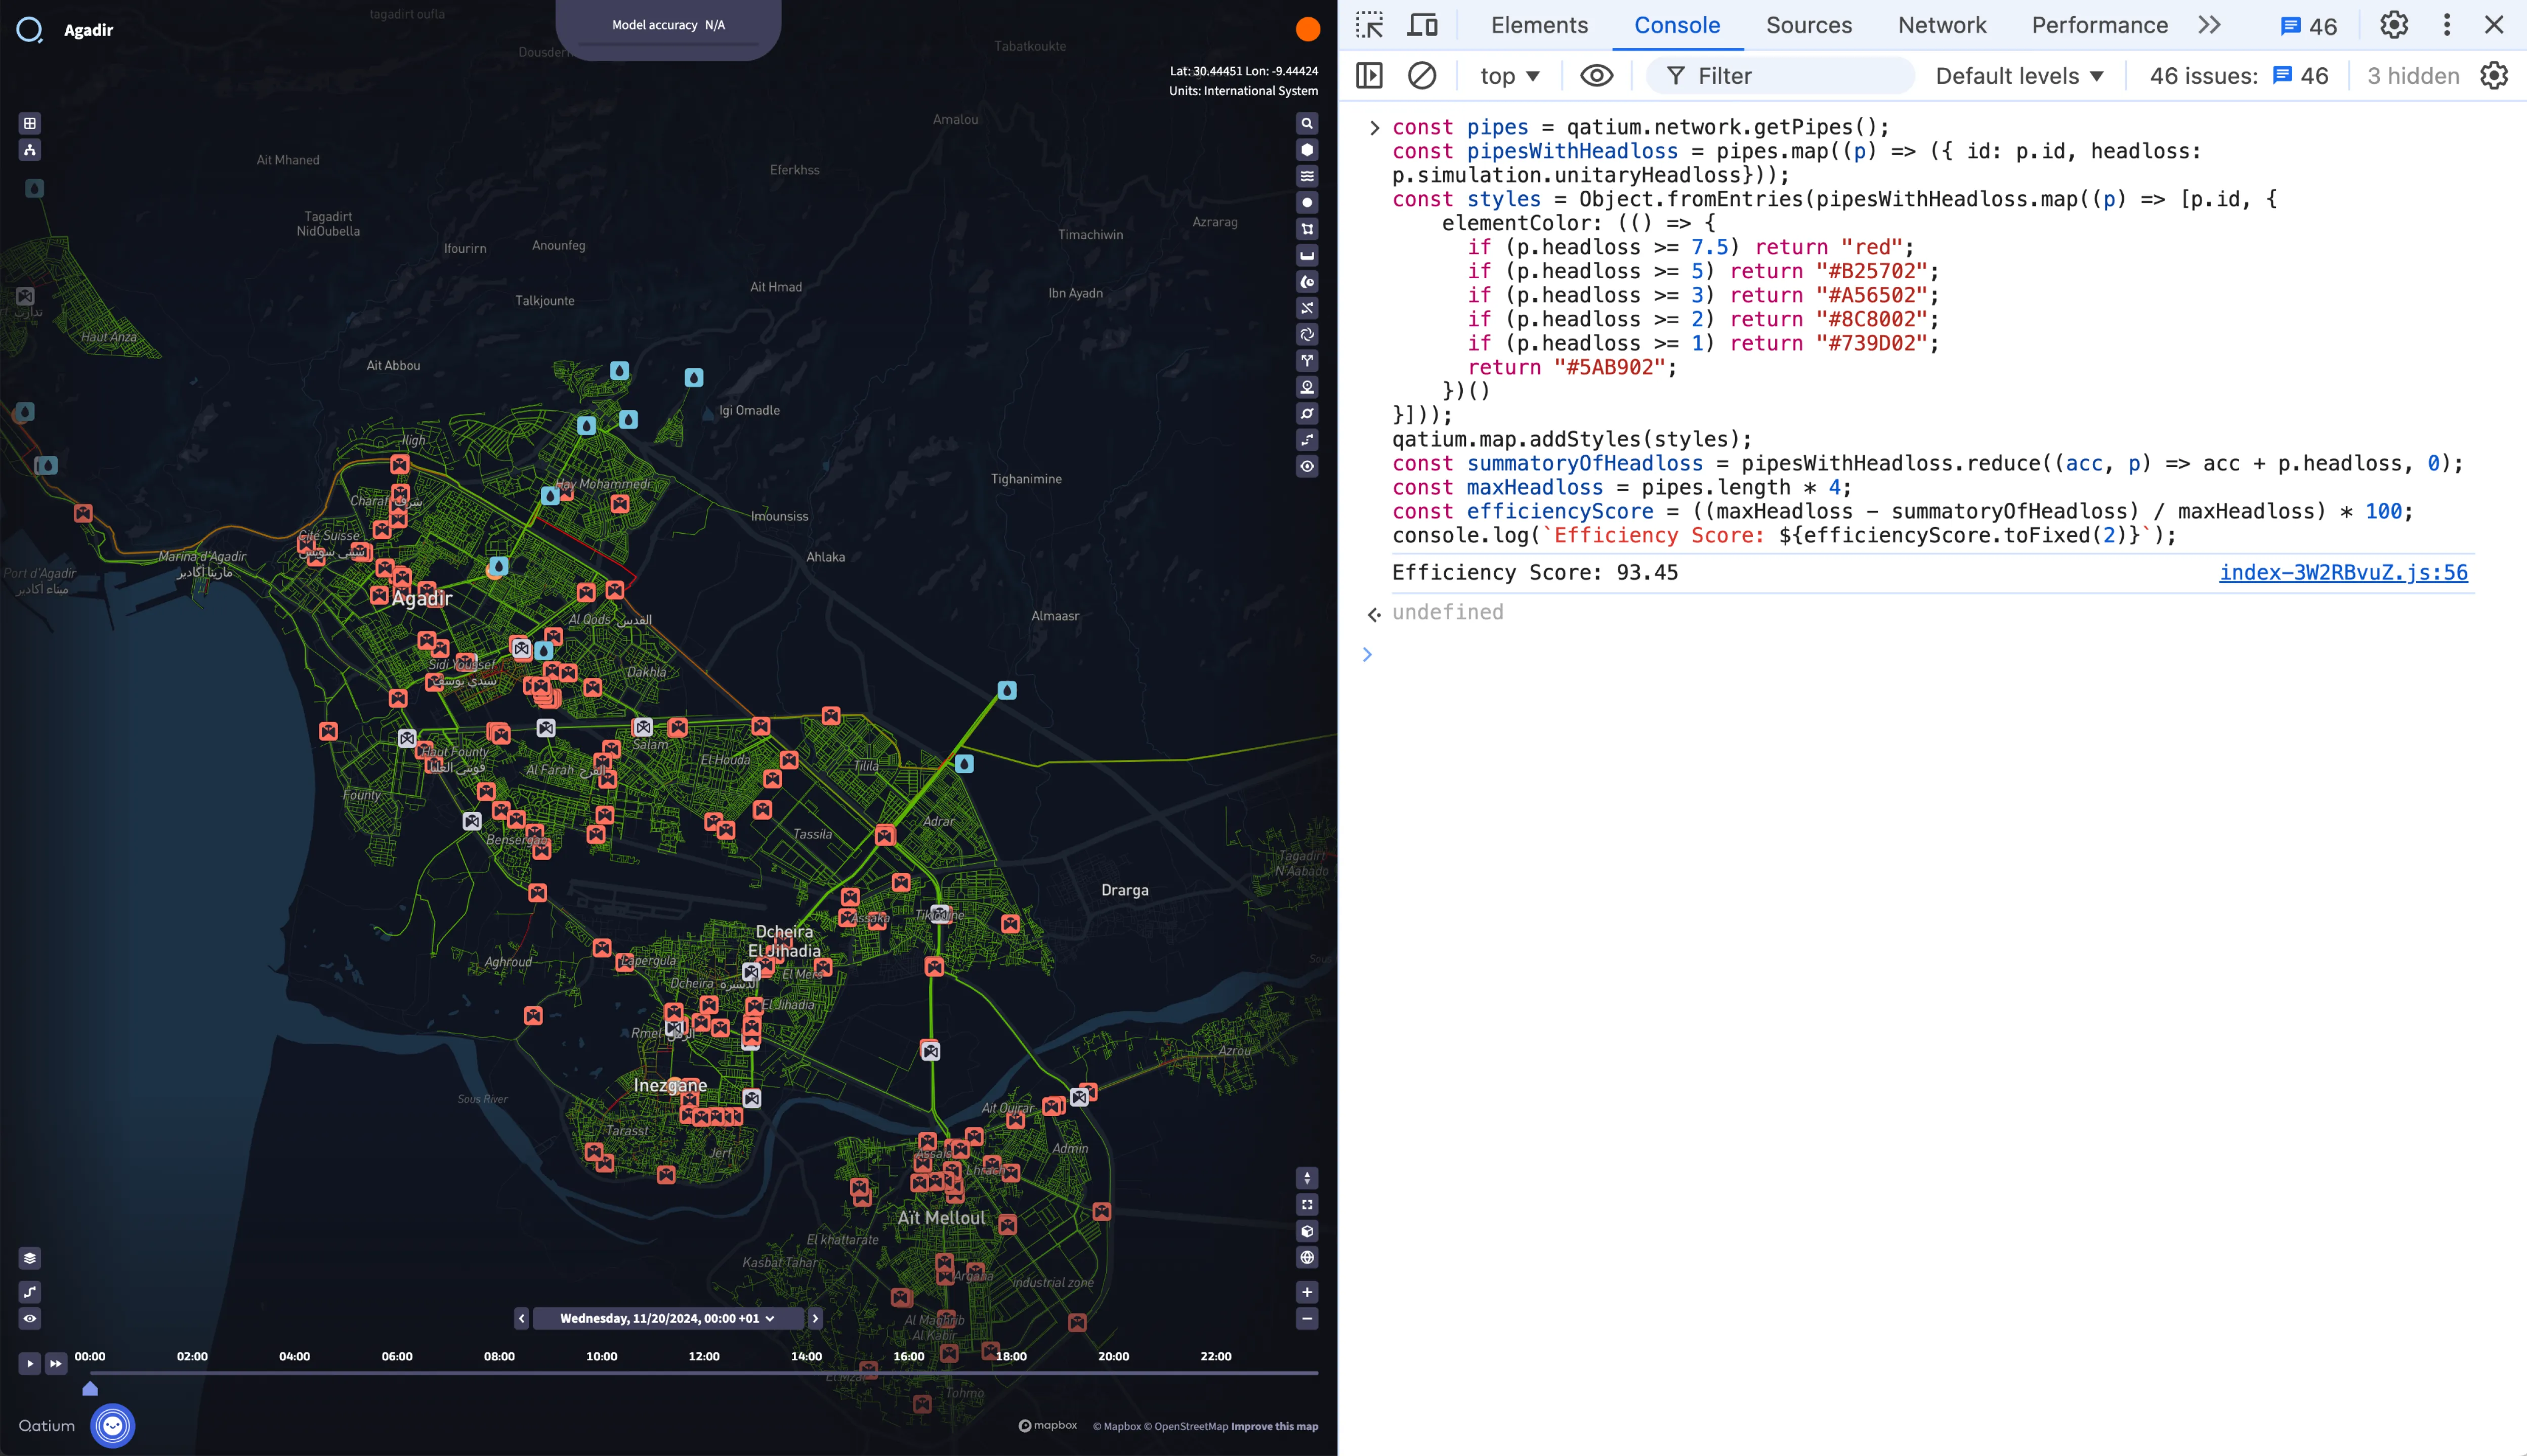
Simultaneously, I worked on a rough algorithm to calculate the Energy
Efficiency Score, using our platform’s SDK. It also rendered the energy efficiency for pipes on the map, using a
color scale:
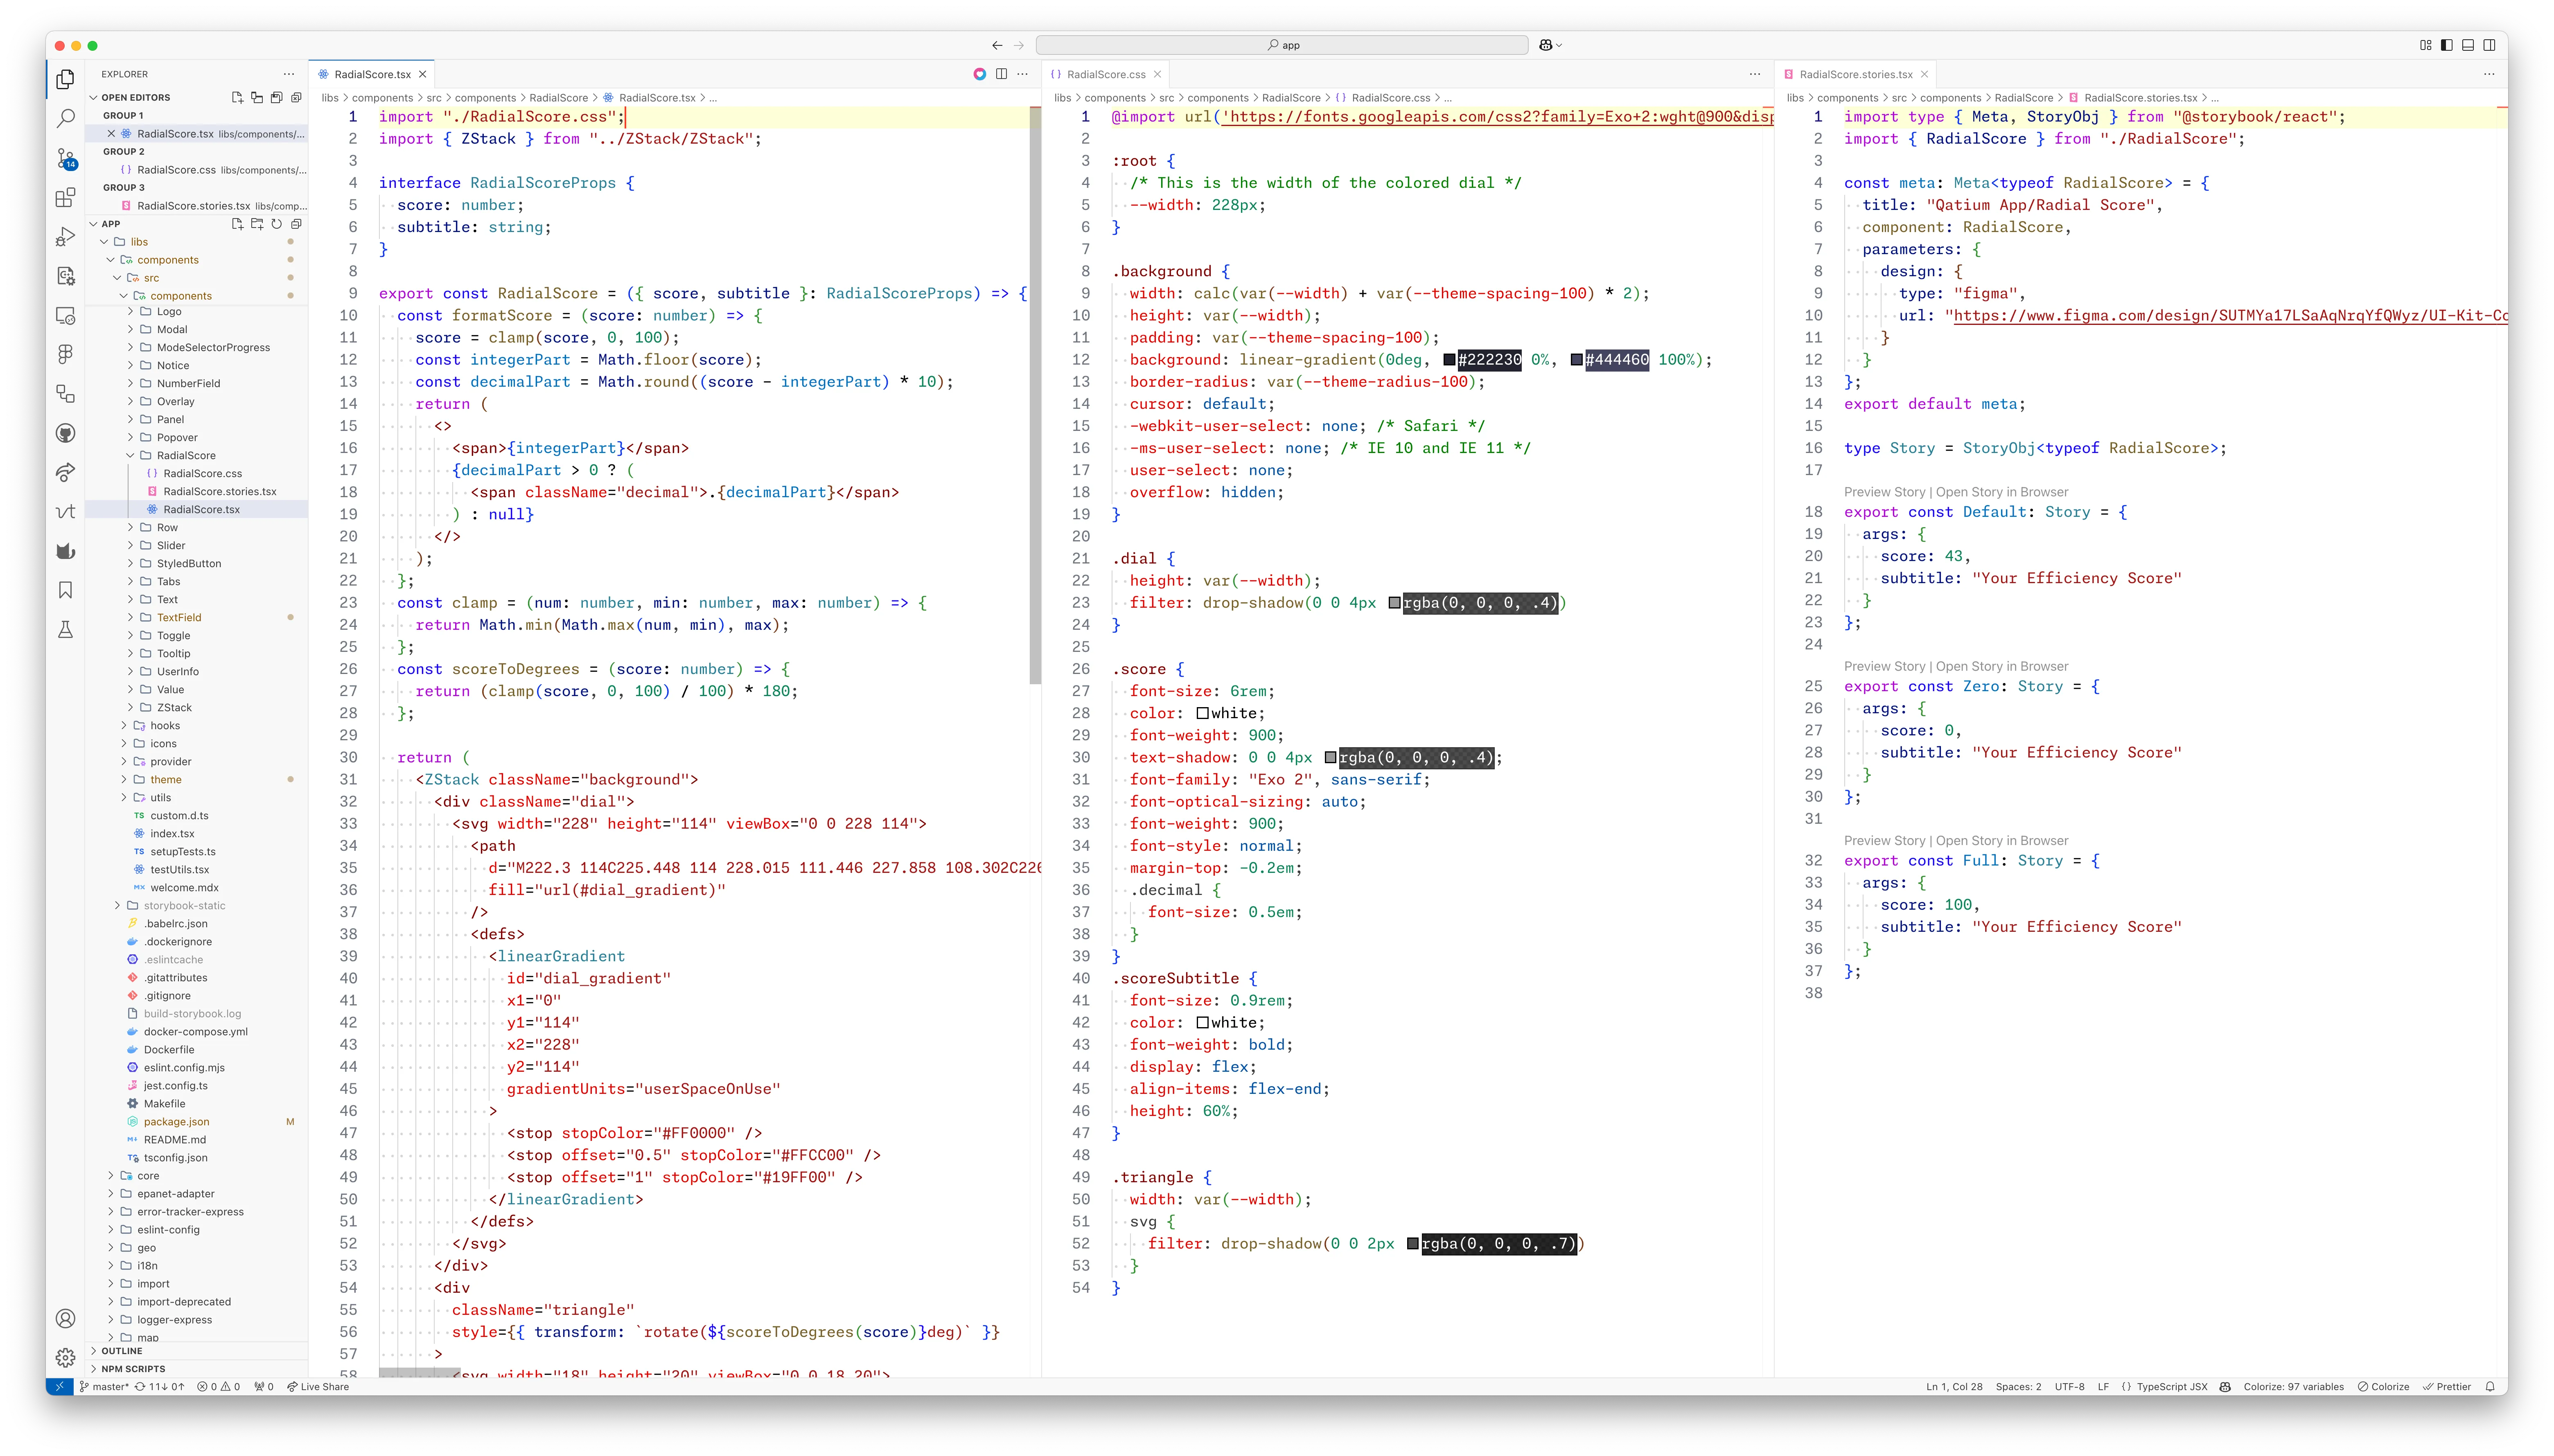
Once I was reasonably sure that our clients would find the feature
useful, I started working on the front end. Our design system already had many of the components I needed, but I had to create a new
one: the radial progress bar.
For that, I used TypeScript, React and SVG, and wrote an isolated
component in Storybook that we could use in other parts of the app. I
also had to add a new layout component, ZStack, to take care of the special needs for this component.
I also added an animation to make the score change more fun:
Click the widget to randomize the value.
Results
The feature was a success, and we got a lot of positive feedback from our clients. It went straight to production without requiring many iterations.
Learnings
You can’t always get what you want. For this particular feature, our customers wanted to see the energy efficiency of their networks in terms of money, but that was not technically feasible.
When you don’t have the ability to speak with end users directly, you can still get a lot of information from attending sales meetings or watching recordings of them. A designer can gather subtle cues from the way customers ask questions, or react to the answers, that may not be obvious to a sales or customer success person.
I learned a lot about hydraulic engineering in a very short time. I don’t know if that’s a plus or a minus 😅. I had to learn how to apply the formulas to our platform. I also had the opportunity to play with our SDK, which was a great experience and gave me some ideas on how to improve its documentation.
I learned I can focus on just a small part of the code and still make the life of my developer colleagues easier. By focusing on the front end, I can still make a big impact.